








Estudio Furia

Estudio Furia clients

Brands that trust us for their digital transformation — from the Americas to Europe

Real cases · audited data

Results that speak

★★★★★  Reviews ↗
Mantello — caso Estudio Furia
MantelloMeta Ads · LATAM
25,0677 campaigns

Conversations started · Jan–Oct 2026

Read the case study
Meta Ads · API · 1/1 a 15/10/2026
Greco Hnos — caso Estudio Furia
Greco HnosMeta Ads · LATAM
7,612from ARS 520 each

B2B conversations · Jan–Oct 2026

Meta Ads · API · 1/1 a 15/10/2026
La Pradera — caso Estudio Furia
La PraderaMeta Ads · LATAM
6.63×77 purchases

Purchase ROAS · Jul–Aug 2026

Meta Ads · píxel de Meta · jul–ago 2026
Finca Bandini — caso Estudio Furia
Finca BandiniMeta Ads · LATAM
1,226↑ leads / mo

Leads generated · Jan–Apr

22
46
89
503
EneFebMarAbr
Meta Ads Manager · 2026

More verifiable results

Meta Ads

Casa Reig863sales generatedAug 2025 – 14 Oct 2026Meta Ads · Meta pixel
Todo Color717sales generatedJul 2025 – Jun 2026Meta Ads · API
Bandini Wines · HoustonUSD0.28per clickJan – Oct 2026Meta Ads · API
La Pradera8.22%ad CTRAug 2026Meta Ads · API
Todo ColorARS386per conversation started90 days to Oct 2026Meta Ads · API

Source: Meta Ads (Ads Manager and the Meta Ads API). Every figure states its own period and comes from the platform shown. Per-account detail on request, under NDA.

Results

SEO cases measured in Search Console

Organic Google traffic, with period and source.

La Pradera Carnes — Premium meat e-commerce

La Pradera Carnes

Premium meat e-commerce

Jul–Sep 2025 vs Jul–Sep 2026

Organic clicks
1406,196
Impressions
5,342195,830
Non-brand clicks
383,548
Clicks per week
0200400600800oct 25jan 26aprjul
Impressions per week
010,00020,00030,000oct 25jan 26aprjul

Google Search ConsoleSearch Console · full weeks

The site starts from a small base: data from Jul 24, 2025, with July covering only 8 days.

Finca Bandini — Winery and wine tourism

Finca Bandini

Winery and wine tourism

Project started from scratch · Jun 23, 2026 to Oct 7, 2026

Clicks per day · Jun 23–29 → Oct 1–7
7.941.1
Impressions per day · Jun 23–29 → Oct 1–7
69325
Clicks per month · Jul → Sep
7871,097
Non-brand clicks · Jul → Sep
288408
Clicks per week
0100200300jul 26
Impressions per week
01,0002,0003,000jul 26

Google Search ConsoleSearch Console · full weeks

July 787 clicks, August 1,003, September 1,097. First Search Console reading: Jun 23, 2026.

Greco Hermanos — Industrial website

Greco Hermanos

Industrial website

Jan–Mar 2026 vs Jul–Sep 2026

Organic clicks
1931,246
Impressions
16,11766,481
Non-brand clicks
171957
Clicks per week
050100150200jul 25octjan 26aprjul

Google Search ConsoleSearch Console · full weeks

Before April 2026 the site had fewer than 100 clicks a month.
Ferrofer — Industrial hardware store

Ferrofer

Industrial hardware store

Jun–Aug 2025 vs Jul–Sep 2026

Organic clicks
1,4081,802
Impressions
34,17562,575
Non-brand clicks
5531,133
Clicks per week
0100200300jul 25octjan 26aprjul

Google Search ConsoleSearch Console · full weeks

Non-brand clicks doubled.
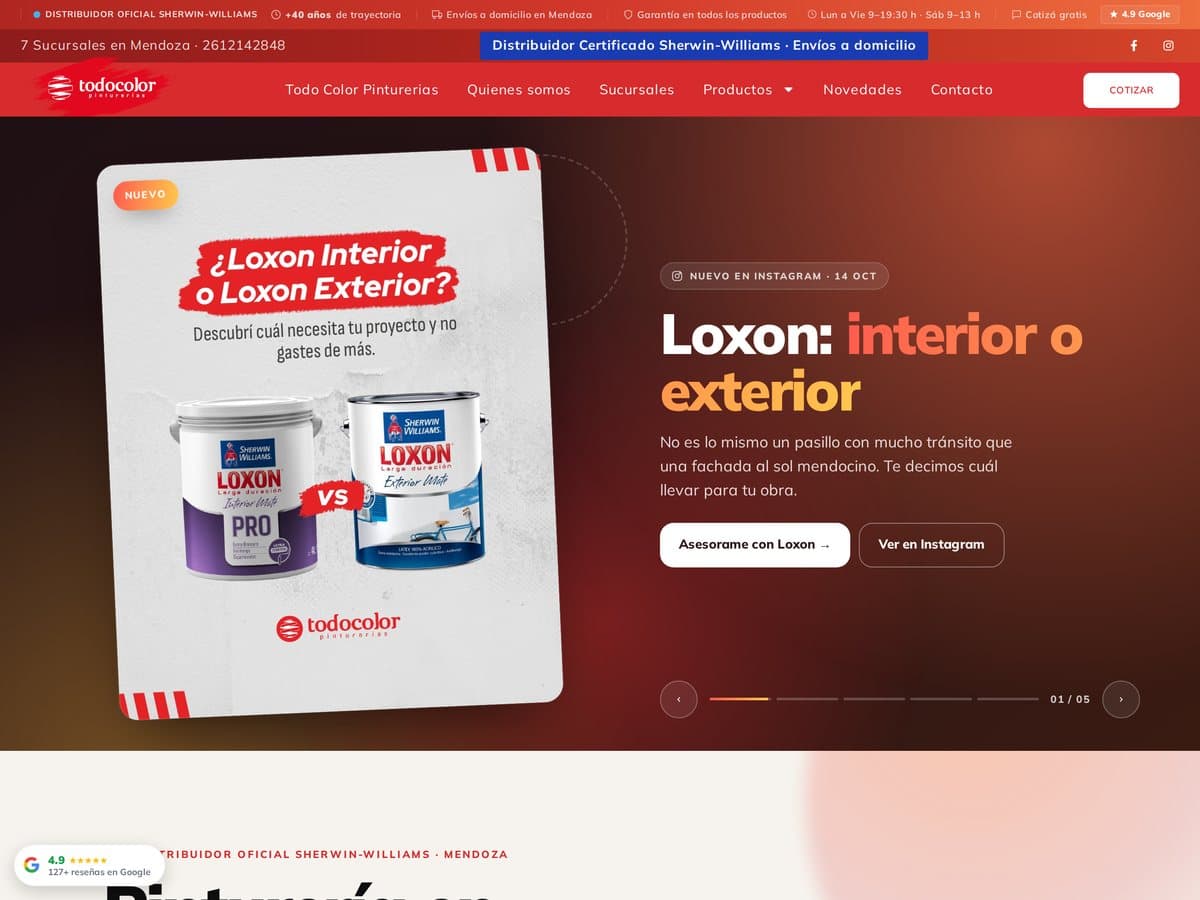
Todo Color Pinturerías — Retail website

Todo Color Pinturerías

Retail website

Jun 1–Aug 30 vs Aug 31–Oct 7, 2026

Clicks per day
10.724.3
Impressions per month · Jun → Sep
11,09830,513
Non-brand clicks · Jun → Sep
110214
Clicks per week
050100150200jul 25octjan 26aprjulAug 31

Google Search ConsoleSearch Console · full weeks

The level changed on Aug 31, 2026 and has held for five weeks. To be confirmed with a full October.
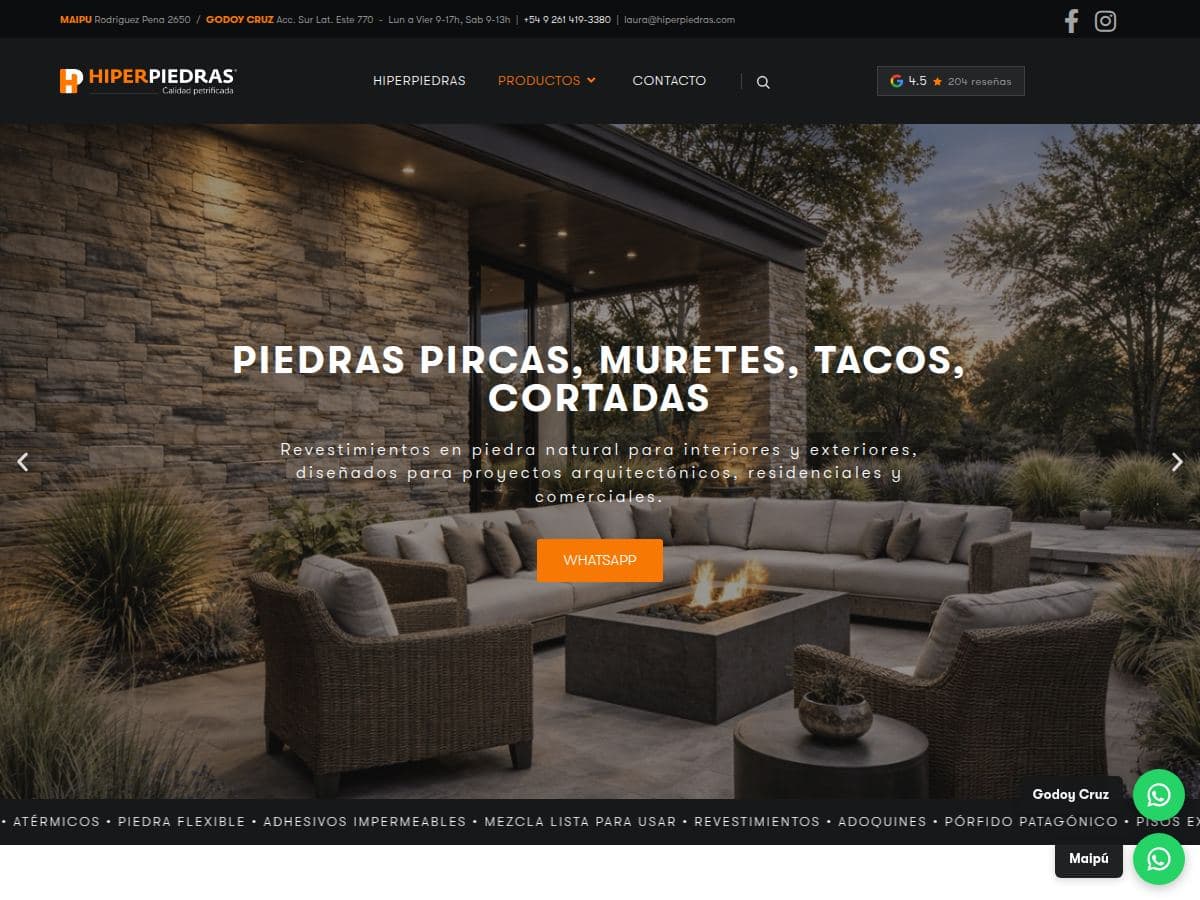
Hiperpiedras — Industrial e-commerce

Hiperpiedras

Industrial e-commerce

Jun 1–Aug 2 vs Sep 14–Oct 7, 2026

Clicks per day
10.521.3
CTR
2.1%4.2%
Average position
6.15.5
Clicks per week
050100150200jul 25octjan 26aprjulAug 3Sep 14

Google Search ConsoleSearch Console · full weeks

Ongoing case: two steps, on Aug 3 and Sep 14.
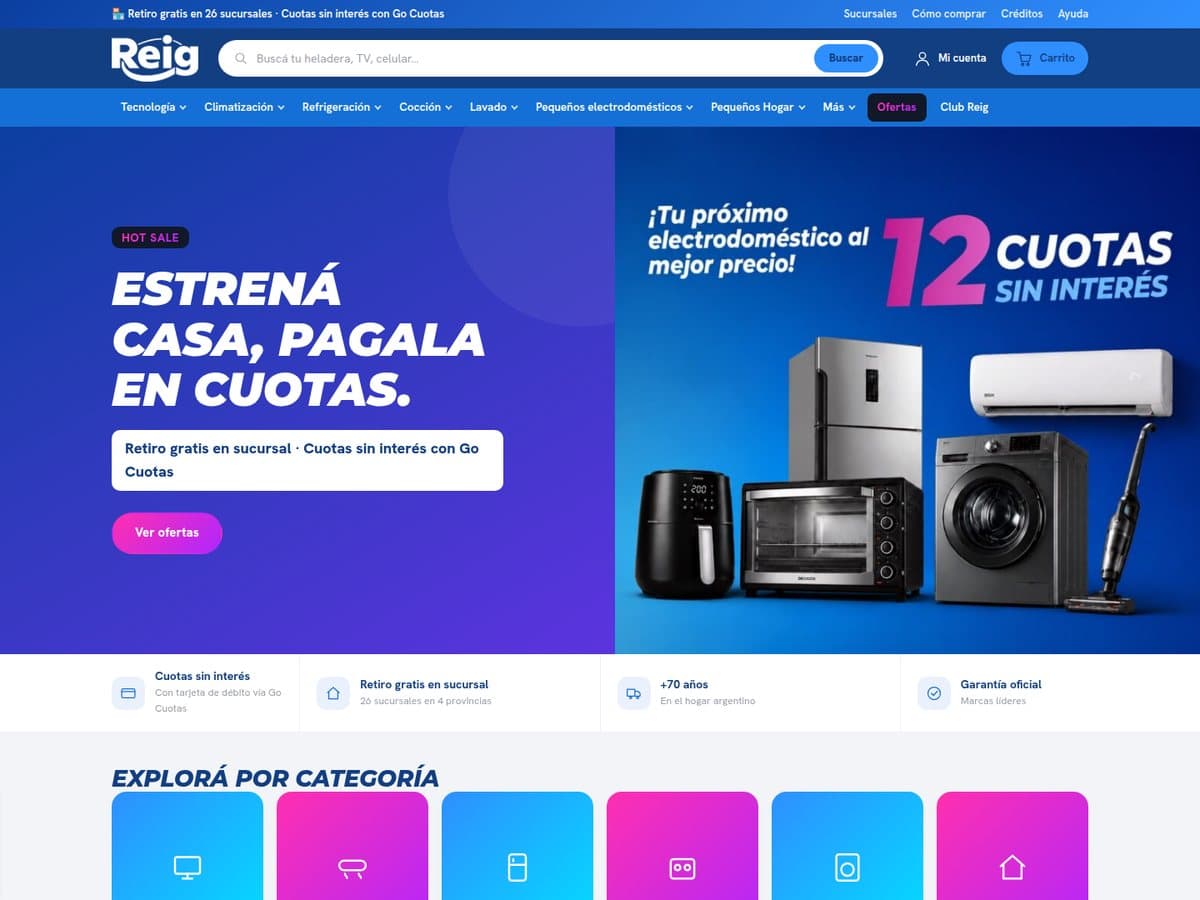
Casa Reig — Retail website

Casa Reig

Retail website

Jul 27–Sep 11, 2025 vs Sep 12, 2025–Oct 7, 2026

Average position
13.97.7
Impressions per day
3,0504,280
Clicks per day
69.073.8
Average position per week (1 = top)
6912151821oct 25jan 26aprjulSep 12

Google Search ConsoleSearch Console · full weeks

Position improves from Sep 12, 2025. Best quarter, Apr–Jun 2026: 6,371 impressions and 90.4 clicks per day.

Oveja Remi — Label design

Oveja Remi

Label design

Jul–Sep 2025 vs Jul–Sep 2026

Average position on Google
24.47.7
Average position · Aug 2025 → Mar 2026
26.97.6
Average position per week (1 = top)
51117232935jul 25octjan 26aprjul

Google Search ConsoleSearch Console · full weeks

Monthly average position: 26.9 in August 2025, 12.1 in January 2026 and 7.6 in March 2026.

Source: Google Search Console of each site, web search type, data as of Oct 8, 2026. Non-brand = total minus queries containing the company name; includes queries anonymized by Google, which cannot be classified. Charts: full weeks, Monday to Sunday, through Oct 4, 2026, no smoothing; vertical lines mark each case's key dates.

Ready to Join Our Clients?

Let's talk about how we can help your brand grow

Contact Us